WAN Utilization
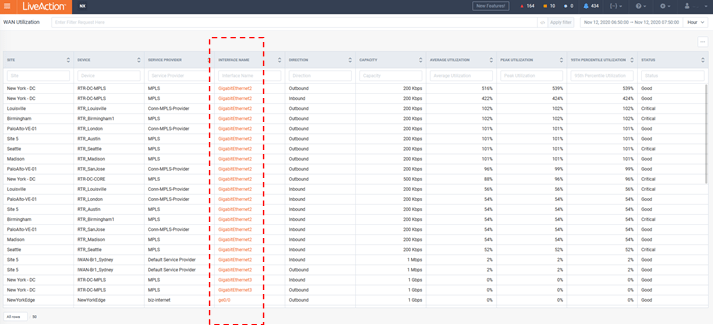
The WAN Utilization story provides a utilization summary of each WAN interface. This includes Average, Peak, and 95th Percentile statistics for the selected time period. This data is based on SNMP utilization.

A Filter can be used to narrow the scope of the story.

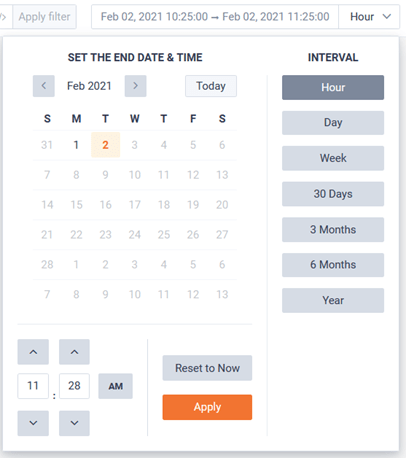
Historic Time intervals can be used.
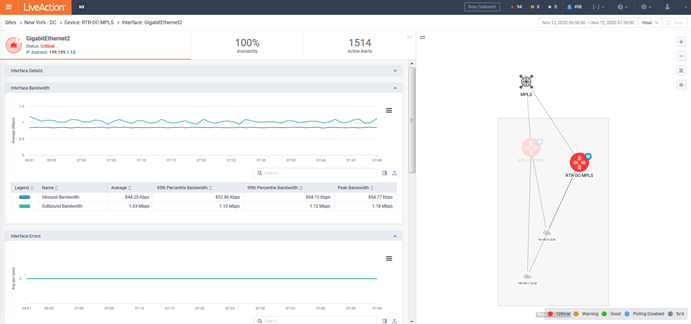
Clicking on an interface will pivot to the Interface Entity page for further investigation.